
The reality factor
Are solar and wind developers fudging the numbers in NYS?

Few residents of upstate NY would describe it as a sunny place. Many people insist that solar energy can’t possibly make sense at this latitude, but in fact NYC is located at roughly the same latitude as Madrid, which seems like a reasonable place to site solar. Buffalo, NY is just a hair north of Rome, Italy, which also seems like a decent spot for generating solar energy.

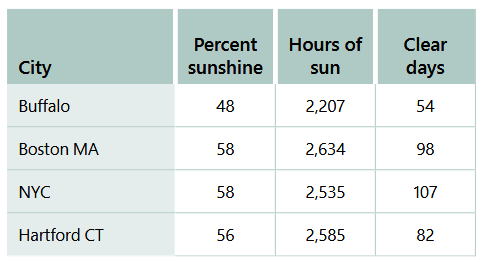
What doesn’t make sense in terms of solar is the amount of cloud cover upstate NY experiences. Buffalo has fewer clear days in a year than Seattle. Even in terms of the relatively cloudy Northeast, Buffalo stands out, as this table shows.1
Both Germany and the United Kingdom are located at northern latitudes and feature quite a bit of cloud cover. Both have extensive solar buildout, so clearly developing solar in such locations is largely a question of economic viability: can a solar project generate enough energy to earn its keep? Thanks to generous subsidies and incentives, the industry answer is almost always “yes.”
In reviewing upstate NY solar project plans, I’m often surprised by just how productive developers state their projects will be. Most claim their projects will generate almost as much electricity as they would in Virginia or North Carolina. When I question this assumption, they’re quick to point to the state-of-the-art equipment they’ll be using.
One thing they don’t do is to say what other plants in upstate NY are generating. There’s a reason for this: the numbers are not good. I’ve wondered for a while how actual generation compares with projections, now that some of these projects have been built. As I was looking into this question, an interesting story broke in the news.
“Bad data leads to bad policy”
During the week of 26 October 2025, the UK government was forced to admit that wind generation is not keeping up with estimates:
Claire Coutinho, the shadow energy secretary and Mr Miliband’s predecessor in the previous Tory government, said: ‘My time in the department convinced me that the Government is relying on bogus numbers that make Net Zero look artificially cheap…. Bad data leads to bad policy.’
Andrew Montford, director of campaign group Net Zero Watch, said: ‘DESNZ’s belated admission that it has been using fictional output figures for windfarm output is welcome, but they still have a long way to go.
‘Even their revised figures are far too high, and their implausible cost figures have long since been refuted by hard data.’2
This was the very issue I’d been exploring in upstate NY, where developers appear consistently to overstate how much electricity they expect their wind and solar projects to generate. And the state happily accepts their estimates.
Solar and wind capacity factors in NYS
Yes, I know I promised fewer numbers in future posts, but I find them hard to ignore, so here’s one more post about them.
Almost every grid-scale wind or solar project I looked at generated less electricity than its developers stated it would. The discrepancy is easiest to understand in terms of capacity factors. In my post Solar capacity and capacity factors, I explained that an energy project’s capacity factor establishes what percentage of the time it generated electricity at full capacity, compared with how much it could produce if it operated at full capacity 24 hours a day, 365 days a year. It’s a useful way of comparing projects and energy sources.
Across the US, solar plants have an average capacity factor of 23%. In NYS, grid-scale solar plants averaged about 17.7% between 2022 and 2024. Residential, commercial, and community solar averages were much lower: about 12.7% between 2021 and 2024.3 That’s as if NYS grid-scale solar plants received 4.2 hours of bright sunshine a day. For smaller installations, it was 3.1 hours a day.
Wind projects average 34% across the US. In NYS, wind facilities averaged 23.8% between 2021 and 2024.4 That seems pretty dismal.

Building solar and wind projects in NYS
To build a solar or wind project in NYS, developers first obtain incentive funding from NYSERDA. In The big fizzle, I explain how NYSERDA solicits bids for grid-scale solar and wind projects every year. Each bid states how much energy the project will generate in a year, based on the developer’s estimate of its capacity factor. For example, a developer might state that its 20-MW solar project will generate 34,000 MWh of electricity a year. This estimate would be based on an annual capacity factor of 19.4%.
How do they know the capacity factor? At some point, they must make an educated guess. They look at capacity factors for other projects, expected weather patterns, and the specifications for the equipment they’re using to estimate what they think it will be, based on this information.
That’s how it’s supposed to work, anyway.
The reality factor
When I was writing What it costs, I noticed that NYSERDA used a highly optimistic capacity factor of 21% in estimating how much solar capacity we will need to meet future Climate Act goals. As I’ve noted, the actual capacity factor for grid-scale solar in upstate NY averages less than 18%. While that number may improve eventually with new technology, 21% seems a bit dubious.
That difference got me wondering just how much NYSERDA looks the other way when it comes to capacity factors as it reviews bids. I looked at actual generating data for seven onshore wind projects and six solar projects with NYSERDA contracts and compared the capacity factor of each project as it was bid to the average of what it generated in 2023 and 2024. These are not the only wind and solar projects that generated electricity in NYS, but they represent the most modern technology being used in NYS; their capacity factors should be quite high. These should be as good as it gets.
The two-part table below shows the results. I’ve listed the project name, the capacity factor (CF) that the developer used to estimate how much energy it would generate in a bid presented to NYSERDA.5 The actual capacity factor was calculated using data from the NYS grid operator.6 I haven’t included a few projects that have only come online recently. Some projects aren’t included in NYSERDA’s contract data files; it’s difficult to determine whether they have contracts with NYSERDA or with another entity.
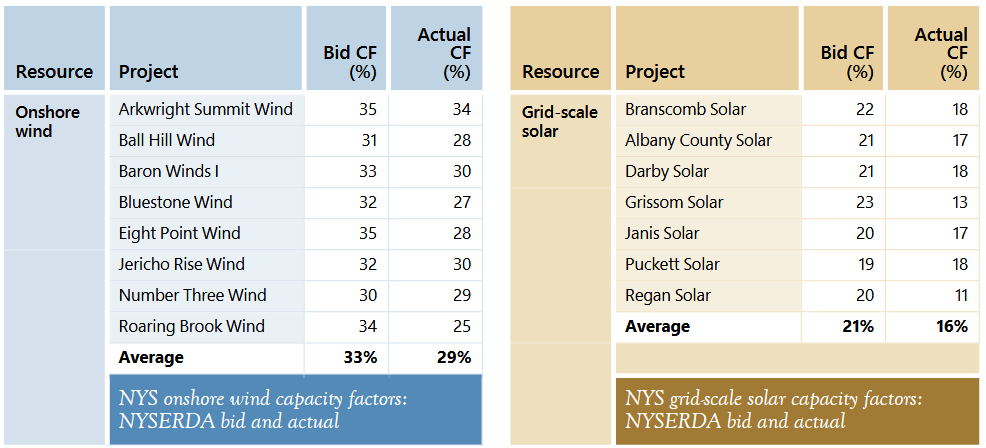
In every case, the amount of electricity estimated by the developer was higher than the actual amount generated.7 For example, Albany County Solar had a bid quantity of 36,084 MWh per year, reflecting the 21% capacity factor that the developers claimed in their siting permit application. But the actual generation amount for the first year was 29,700 MWh, reflecting a much more typical capacity factor of 17%.8
Overall, wind projects were being bid with an average estimated capacity factor of 33% but generated only an average of 29%, meaning they only generated 88% of what they were expected to. Solar projects were worse. The bid capacity factors averaged 21%, but actual capacity factors averaged just over 16%, meaning projects only generated 76% of the electricity expected.
Note also that the bid capacity factor doesn’t reflect maximum generation; each contract also specifies how much total energy NYSERDA will pay for if the project overproduces. Those numbers are completely implausible, of course.
Again, you might expect NYSERDA to recognize immediately when the numbers supplied by a developer are inconsistent with actual numbers being obtained by projects in service. Yet NYSERDA appears content to accept these giddy estimates of how much electricity a project will generate.
Conclusions
We’re facing a similar situation to the UK’s. Actual wind and solar generation don’t match what was expected because someone seems to have fudged the numbers. Developers appear to overstate routinely the amount of electricity their facilities will generate, and government authorities accept their estimates.
Several consequences result. First, we’re not getting an accurate picture of the cost of wind and solar. Projects are bid on the amount of electricity they produce; if this amount is overstated, the project looks cheaper than it is. Our statewide estimates of the cost of wind and solar are thus incorrect. Second, developers who overstate expected electric generation gain an unfair advantage in competitive bidding. And third, our progress toward meeting 2030 and 2040 Climate Act targets has been slower than we expected, meaning the state will need to solicit more contracts for solar and wind projects.
NYSERDA isn’t using realistic numbers to estimate the progress of NYS’s solar and wind buildout. It appears to be overestimating new wind capacity by 12% and solar capacity by 24%. NYSERDA should require new bids to use reasonable capacity factors for upstate facilities (under 20%) or present a convincing explanation of why they expect higher capacity factors. It should also view with skepticism any new bids submitted by developers who overstated generation in the past.

But these are remedial measures that fail to address more fundamental issues. If developers have been allowed to provide misleading capacity factor estimates, what else have they been failing to report accurately? Why should we trust them? For that matter, why trust NYSERDA?
Thanks for reading, and I hope you found it useful! If you think it might help others, please click “like” (heart) to support my work and boost its position in Substack searches.
I’ve provided a PDF of this post in case you’d rather share it that way:
Photos by Daniel Pascoa and Jessezhou Uva on Unsplash.
Data from Current Results, https://www.currentresults.com/Weather/US/average-annual-sunshine-by-city.php.
Greg Heffer, Ed Miliband admits wind farms will generate less power than thought, 29 October 2025, MSN, https://www.msn.com/en-us/money/markets/ed-miliband-admits-wind-farms-will-generate-less-power-than-thought/ar-AA1Pqipp.
New York Independent System Operator (NYISO), NYCA Renewables 2024, 1 April 2025, https://www.nyiso.com/documents/20142/50614388/2024%20NYCA%20Renewables%20Presentation%20FINAL%20(1).pdf/4fdf8efa-fe55-0161-9f12-c3f79d1757db.
NYISO, NYCA Renewables 2024.
Data.ny.gov website, Large-scale renewable projects reported by NYSERDA: beginning 2024, https://data.ny.gov/Energy-Environment/Large-scale-Renewable-Projects-Reported-by-NYSERDA/dprp-55ye/about_data, accessed 10 October 2025.
NYISO, 2025 Gold Book: 2025 NYCA Existing Generating Facilities, https://www.nyiso.com/documents/20142/51231901/2025-NYCA-Existing-Generating-Facilities.xlsx/6a8b1cda-6bf3-f546-0f18-737a7835c686.
NYSERDA lists both a bid generation amount for each project and a maximum generation amount. I used the smaller number.
Generating data from NYISO Gold Book. Again, Solar capacity and capacity factors discusses typical capacity factors for solar in NYS in much more detail.
Do these companies who quote these solar & wind projects have to stand behind the savings numbers that they worked out, to get the financial incentives from the sources to build these projects out?
When we submit a quote for our equipment, it has to be submitted with a calculation sheet stating what the energy saving are going to be as well as the reduction in CO2 emissions.
Our clients would submit this information, and knew if approved that testing would be done after installation, confirming the savings. We were always very positive and sure in the numbers we submitted, but also realized that if for some reason our equipment would not or did not pass the test, our clients would not get the incentive money - and they would then look at us to remove our equipment and refund everything that they had paid us.
It never happened, but right now I sure am glad we were not selling solar or wind systems.
Maybe it is different with government? Maybe with them, even with poor or negative results, you are still entitled to the "trophy" because of effort?
At some point, which drives the question when, the consumers wil recognize the charlatans promoting wild and solar are lying. The solar panels don’t performs as promised, degrade over a short couple of tears, and leak nasty chemicals on everything below. The wind turbines don’t last as long as promised, require more maintenance than advertised, and impactthe environment in multiple ways. But the overriding issue is tte cost. And the only cost is the cost to consumers on their electric bills. Thise bills are higher than the inflation increase for traditional electricity generation. We can just burger the so called LCOE (really Liars Cist if Energy) and just look at the bills customers are presented every month. So push back hard on politicians complicit with this wind and solar charade. Vote wisely, throw the bums out, they’ve likely accumulated enough lobbyists benefits to live in comfort.